2024. 3. 26. 13:50ㆍ카테고리 없음
- 환경
- ubuntu 20.04.4 LTS
- docker
- fluent/fluentd:v1.16-1
- prom/prometheus (version이 어떻게 되는지 추가 확인 필요)
- grafana(version 적어야 함)
- 구성도
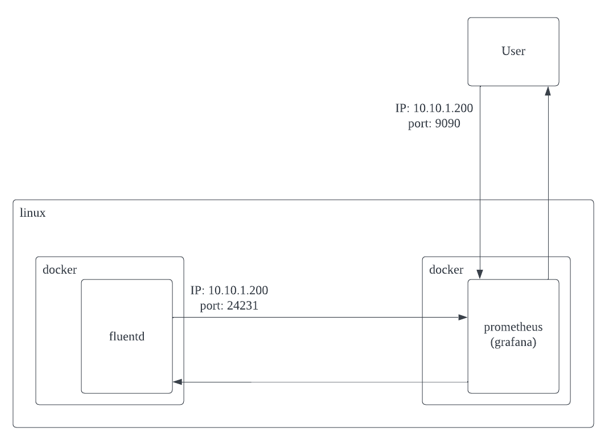
- docker 기반의 fluentd에서 prometheus에 전달하기 위한 port 개방
- docker 기반의 prometheus에서 주기적으로 fluentd의 데이터들을 가져오면서 외부에 웹 뷰로 공개 하기 위해 port 개방
- 세팅
- fluentd
- fluentd를 prometheus에 연동할려면 플러그인을 설치해야 한다
- docker로 실행 할 경우에는 dockerfile을 만들어서 자체 이미지를 만들어야만 플러그인 설치를 할 수 있다
- fluentd
1) linux 명령어 실행
참고: https://github.com/fluent/fluentd-docker-image?tab=readme-ov-file#how-to-build-your-own-image
GitHub - fluent/fluentd-docker-image: Docker image for Fluentd
Docker image for Fluentd. Contribute to fluent/fluentd-docker-image development by creating an account on GitHub.
github.com
# Create project directory.
mkdir custom-fluentd
cd custom-fluentd

# Download default fluent.conf and entrypoint.sh. This file will be copied to the new image.
# VERSION is v1.7 like fluentd version and OS is alpine or debian.
# Full example is https://raw.githubusercontent.com/fluent/fluentd-docker-image/master/v1.10/debian/fluent.conf

curl https://raw.githubusercontent.com/fluent/fluentd-docker-image/master/VERSION/OS/fluent.conf > fluent.conf

curl https://raw.githubusercontent.com/fluent/fluentd-docker-image/master/VERSION/OS/entrypoint.sh > entrypoint.sh
chmod +x entrypoint.sh

# Create plugins directory. plugins scripts put here will be copied to the new image.
mkdir plugins

curl https://raw.githubusercontent.com/fluent/fluentd-docker-image/master/Dockerfile.sample > Dockerfile
위 명령어중 주의해야 할 점은 curl로 데이터를 가져오는 명령어다
2024-03-22 기준 Dockerfile 외에 정상적으로 데이터를 가져오지 않는다..

fluent.conf는 개인이 저장한 파일로 세팅 할 거기 때문에 상관없지만 entrypoint.sh는 안에 무슨 내용인지 몰라 인터넷 검색을 해보니 github로 docker fluent 버전마다 관리하고 있는 페이지를 발견해서 내용을 알 수 있었다.
참고: https://github.com/fluent/fluentd-docker-image/blob/master/v1.16/alpine/entrypoint.sh
#!/bin/sh

#source vars if file exists
DEFAULT=/etc/default/fluentd

if [ -r $DEFAULT ]; then
    set -o allexport
    . $DEFAULT
    set +o allexport
fi

# If the user has supplied only arguments append them to `fluentd` command
if [ "${1#-}" != "$1" ]; then
    set -- fluentd "$@"
fi

# If user does not supply config file or plugins, use the default
if [ "$1" = "fluentd" ]; then
    if ! echo $@ | grep -e ' \-c' -e ' \-\-config' ; then
       set -- "$@" --config /fluentd/etc/${FLUENTD_CONF}
    fi

    if ! echo $@ | grep -e ' \-p' -e ' \-\-plugin' ; then
       set -- "$@" --plugin /fluentd/plugins
    fi
fi

exec "$@"
위 내용으로 entrypoint.sh을 저장한다
저장 했다면 docker run 실행 시 권한을 줘야 하기 때문에 밑의 명령어를 실행한다
chmod +x entrypoint.sh
내가 세팅한 fluent.conf 내용은 아래와 같다
<source>
  @type http
  @label @SANDBOX
  port 24225
  bind 0.0.0.0
</source>

<source>
  @type http
  @label @REAL
  port 24224
  bind 0.0.0.0
</source>

<source>
  @type prometheus
  bind 0.0.0.0
  port 24231
  metrics_path /metrics
</source>

<source>
  @type prometheus_output_monitor
  interval 10
  <labels>
    hostname ${hostname}
  </labels>
</source>

<label @SANDBOX>
  <filter **>
    @type prometheus
    <metric>
      name fluentd_input_status_num_records_total
      type counter
      desc The total number of incoming records
      <labels>
        tag ${tag}
        hostname ${hostname}
      </labels>
    </metric>
  </filter>

  <match **>
    @type copy
    <store>
      @type stdout
    </store>

    <store>
      @type forward
      <server>
        name here your name
        host here your host
        port 24224
      </server>
    </store>

    <store>
      @type prometheus
      <metric>
        name fluentd_output_status_num_records_total
        type counter
        desc The total number of outgoing records
        <labels>
          tag ${tag}
          hostname ${hostname}
        </labels>
      </metric>
    </store>
  </match>
</label>

<label @REAL>
  <match **>
    @type copy
    <store>
      @type stdout
    </store>
    <store>
      @type forward
      <server>
        name here your name
        host here your host
        port 24224
        weight 50
      </server>
      <server>
        name here your name
        host here your host
        port 24224
        weight 50
      </server>
      <server>
        name here your name
        host here your host
        port 24224
        weight 50
      </server>
      <server>
        name here your name
        host here your host
        port 24224
        weight 50
      </server>
    </store>
  </match>
</label>
프로메테우스에 대한 코드만 보자면
1. source 태그를 통해 prometheus의 지표를 전달하기 위해 24231 포트를 개방( prometheus_output_monitor 도 연관)
2. label 태그의 filter ** 태그로 @SANDBOX로 전달된 모든 입력 데이터를 prometheus의 fluentd_input_status_num_records_total 변수 증가 카운팅
3. copy - store 태그를 @SANDBOX 로 전달할 모든 출력 데이터를 prometheus의 fluentd_output_status_num_records_total 변수 증가 카운팅
과정을 하는 코드라고 보면 된다
curl로 다운로드한 Dockerfile을 vi로 열어 prometheus plugin을 추가한다
FROM fluent/fluentd:v1.16-1

USER root

RUN apk add --no-cache --update --virtual .build-deps \
        sudo build-base ruby-dev \
 && sudo gem install fluent-plugin-prometheus \
 && sudo gem sources --clear-all \
 && apk del .build-deps \
 && rm -rf /tmp/* /var/tmp/* /usr/lib/ruby/gems/*/cache/*.gem

COPY fluent.conf /fluentd/etc/
COPY entrypoint.sh /bin/

USER fluent
2) docker image 생성
docker build -t custom-fluentd:latest ./3) docker 실행
docker run -d --name fluentd -p 24224:24224 -p 24225:24225 -p 24231:24231 custom-fluentd4) 로그 전송
curl -X POST -d 'json={"json":"message"}' http://127.0.0.1:24225/sample.test5) 로그 확인
docker logs -f --tail 1000 fluentd
6) 프로메테우스에 전달할 지표값들이 증가하는지 확인
curl http://localhost:24231/metrics

위와 같이 fluentd_input_status_num_records_total 값이 증가되었다면 세팅 성공이다
(위 스샷은 이것저것 테스트 해보느라 실제 따라 하는 사람이랑 다를 수 있다)
- prometheus 설치
Installation | Prometheus
An open-source monitoring system with a dimensional data model, flexible query language, efficient time series database and modern alerting approach.
prometheus.io
Monitoring by Prometheus | 1.0 | Fluentd
Since both Prometheus and Fluentd are under CNCF (Cloud Native Computing Foundation), Fluentd project is recommending to use Prometheus by default to monitor Fluentd. Example Fluentd Configuration Step 1: Counting Incoming Records by Prometheus Filter Plug
docs.fluentd.org
prometheus를 docker로 실행할 때 fluentd와 연동하기 위해 prometheus.yml 파일을 미리 만들어야 한다
global:
  scrape_interval: 10s # Set the scrape interval to every 10 seconds. Default is every 1 minute.

# A scrape configuration containing exactly one endpoint to scrape:
# Here it's Prometheus itself.
scrape_configs:
  - job_name: 'fluentd'
    static_configs:
      - targets: ['here your ip:24231']
AWS EC2 머신에 포트 개방을 해야 한다
1) docker 실행
docker run -p 9090:9090 -v here your path/prometheus.yml:/etc/prometheus/prometheus.yml prom/prometheus2) 프로메테우스 접속
http://here your ip:9090/AWS EC2 머신에 포트 개방을 해야 한다
3) fluentd 노드 접속 확인

State - UP 상태일 경우 fluentd <-> prometheus 연결 성공
- fluentd에 prometheus를 연동한 이유
- APP - log들이 fluentd로 모여서 처리하는 경우 fluentd의 트래픽이나 장애 상황(ex. 전송 실패)등 모니터링을 하지 않을 경우 APP에서는 알 방법이 없기 때문에 필수로 연결해야 한다
- 사용 방법
- fluentd prometheus plugin: https://github.com/fluent/fluent-plugin-prometheus
- fluentd prometheus plugin sample: https://github.com/fluent/fluent-plugin-prometheus/blob/master/misc/fluentd_sample.conf
- 통계 1: https://docs.fluentd.org/monitoring-fluentd/monitoring-prometheus#list-of-fluentd-metrics
- 통계 2: https://sysdig.com/blog/fluentd-monitoring/
Monitoring by Prometheus | 1.0 | Fluentd
Since both Prometheus and Fluentd are under CNCF (Cloud Native Computing Foundation), Fluentd project is recommending to use Prometheus by default to monitor Fluentd. Example Fluentd Configuration Step 1: Counting Incoming Records by Prometheus Filter Plug
docs.fluentd.org
fluent-plugin-prometheus/misc/fluentd_sample.conf at master · fluent/fluent-plugin-prometheus
A fluent plugin that collects metrics and exposes for Prometheus. - fluent/fluent-plugin-prometheus
github.com
How to monitor and troubleshoot Fluentd with Prometheus
Learn how to monitor Fluentd with Prometheus. Also discover the most common Fluentd issues and how to troubleshoot them.
sysdig.com
GitHub - fluent/fluent-plugin-prometheus: A fluent plugin that collects metrics and exposes for Prometheus.
A fluent plugin that collects metrics and exposes for Prometheus. - fluent/fluent-plugin-prometheus
github.com

예를 들어 2024-03-26일 기준 세팅하면 위와 같은 값들을 PromQL을 사용해서 확인해 볼 수 있다
그 외 참고
프로메테우스 ip 관리: https://magpienote.tistory.com/263